
Admin: Overview
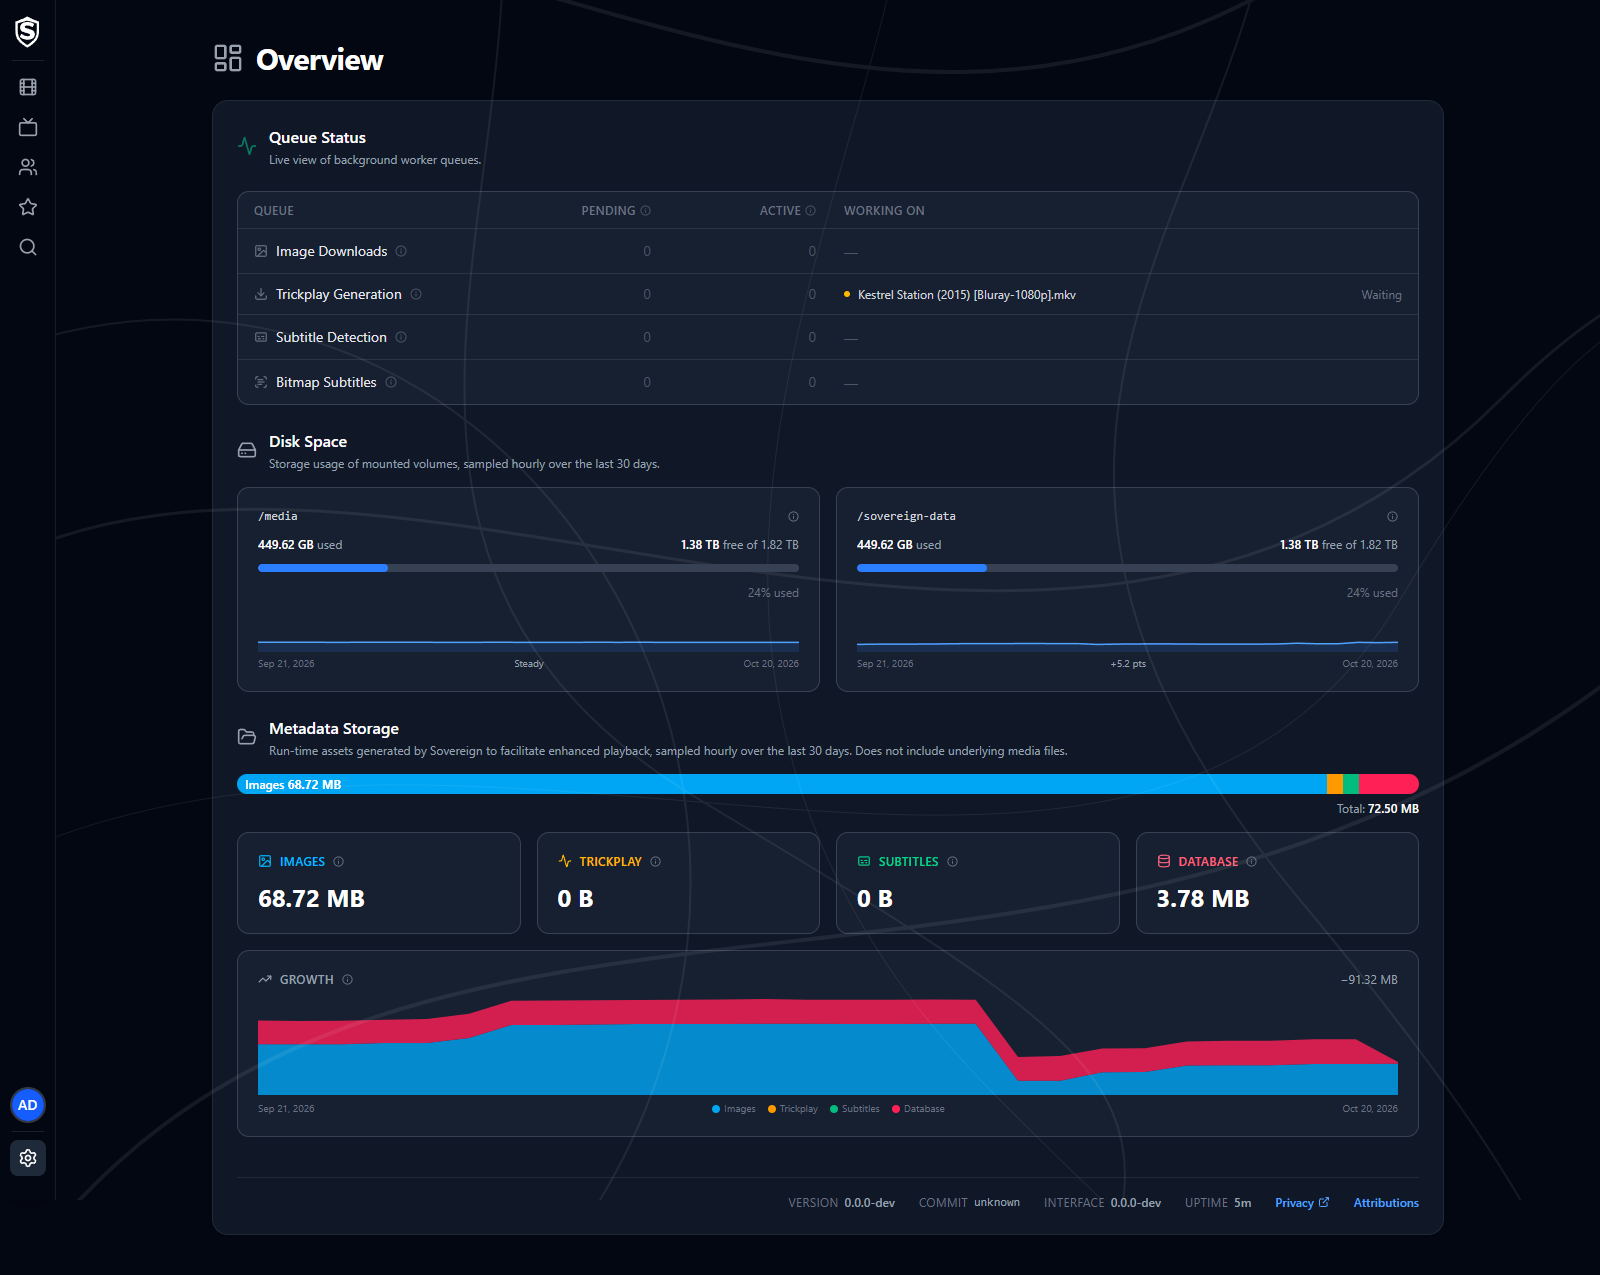
The Overview page of Admin Settings is the server dashboard. The queue status updates live, so you can watch background work as it happens, and a connection indicator beside it confirms live updates are flowing.
The Admin Menu
Section titled “The Admin Menu”The gear icon at the foot of the navigation rail opens the admin menu. Overview sits at the top on its own, and every other page belongs to a group with its own submenu:
- Monitoring - Active Streams, Analytics, Activity Logs.
- Library - Media Sources, Jobs, Playback Simulator.
- Users & Devices - Users, Clients, Client Errors.
- System - Configuration, Email, GPU / Codecs, FFmpeg, Logs, License, Backup & Restore.
Each page is headed with the name of its group, and a strip of tabs under the heading moves between the pages of that group without reopening the menu.
Queue Status
Section titled “Queue Status”A live view of the server’s background worker queues, one row each:
- Image Downloads - fetches poster and backdrop artwork as new media is added.
- Trickplay Generation - builds the thumbnail previews used when scrubbing the player timeline. Runs the first time a title is played.
- Subtitle Detection - checks a file for its subtitle tracks so they can be offered in the player. Runs the first time a title is played, and takes about a second.
- Bitmap Subtitles - turns an image-based track (PGS or VOBSUB, common on Blu-ray rips) into one image per line for the player to draw. Runs when a viewer selects that track, and can be the longest-running job on the server: under a minute where the file carries an index to seek by, and tens of minutes where it doesn’t and the whole file has to be read through.
Text subtitle tracks have no row of their own. They’re produced by the same pass that produces the video you’re watching, so there’s no queue for them and nothing to wait on.
Alongside the pending and active counts, each row names what it’s working on: the file, plus the track when the job is for a single track. The wording matches the server log, so you can find the log line for a row. Elapsed time sits at the end.
A row can show an item as Waiting. That means a worker has picked the item up but hasn’t started it, because trickplay and bitmap subtitles share one ceiling and the other one holds it. Waiting items aren’t counted as active, which is why a row can name an item next to an active count of zero.
Set how many of those jobs run at once with Sovereign__AssetWork__MaxConcurrentJobs. See system requirements for what to weigh before raising it.
Disk Space
Section titled “Disk Space”Storage usage for each mounted volume (typically your media mount and the Sovereign data directory), with a usage bar per mount point and a chart of the last 30 days beneath it. The bar turns amber at 75% and red at 90%.
Reading a mount is slow on a busy or networked volume, so Sovereign records each volume’s capacity once an hour and the figure can be up to an hour old. Those samples also build the history, which shows whether a volume that’s 94% full got there last week or has been filling all month. A change of less than half a point across the window reads as Steady.
Samples are kept for 400 days by default. Set Sovereign__Storage__RetentionDays to change that, or to 0 to keep them forever. The same setting covers the Metadata Storage history below, since one hourly job records both. A volume that stops being mounted drops off the page once its last sample ages out of the window.
When a volume Sovereign writes to runs low, a banner naming the mount, its free space and when it crossed the line sits above every admin page, not just this one. It can’t be dismissed, and it clears itself once free space recovers. A volume is Running low at 10% or 5 GiB free and Critically low at 5% or 1 GiB free, whichever trips first. Change those with Sovereign__Storage__WarningPercentFree, Sovereign__Storage__WarningBytesFree and their Critical counterparts, or set all four to 0 to turn the alert off. If email is set up, administrators are mailed about it as well.
Metadata Storage
Section titled “Metadata Storage”A breakdown of the run-time assets Sovereign generates for playback: artwork, trickplay previews, extracted subtitles, and the database itself. Your media files themselves aren’t included.
The bar across the top shows the split, the four cards below give each figure on its own, and the Growth chart stacks them over the last 30 days. Hover any day in the chart for that day’s full breakdown. Artwork settles once your library has been scanned, while trickplay and subtitles keep climbing as titles are played for the first time, so the chart is where you’ll see which of them is growing fastest.
These figures come from the same hourly sample as Disk Space, so they can be up to an hour old, and the chart needs a couple of days behind it before there’s a shape to draw. Until then it says so in place of the graph.
Temporary video segments aren’t counted here. They’re scratch files that exist only while something is playing and are cleaned up when the stream ends, so an hourly reading of them would almost always be zero. Watch playback in progress on the Active Streams page instead.
The version and build commit of the running server, the version of the web interface your browser is running, and the server’s uptime sit along the bottom of the page. Quote them when you report a problem.
Titles, artwork, people and descriptions shown in screenshots are fictional and were created for illustration. Sovereign doesn't include or supply any media: it plays the library you bring.